Introduction
Insurance feels complicated for a reason. 57% of young Europeans across 33 countries struggle to understand insurance purchases, and 82% report they never received adequate financial education to make informed decisions. Most policyholders have no idea whether their premiums are fair, their coverage is adequate, or if they're paying for duplicate protections already covered elsewhere. Opaque pricing models and deliberately complex policy language make comparison nearly impossible — by design.
Data analytics is changing this dynamic. The same methods insurers use internally to price policies, detect fraud, and predict risk are now emerging as tools that empower consumers too. This article covers what data analytics in insurance actually means, the key benefits it delivers, real-world use cases, types of analytics deployed, and the trends shaping both the industry and consumer transparency.
TLDR:
- Data analytics shifts insurance from broad population averages to individual-level risk insights
- AI-driven claims processing reduces resolution time from weeks to minutes
- Fraud detection models flag anomalies in real time, cutting into the ~10% of European claims expenditure lost annually to fraud
- Consumer-facing analytics platforms now give policyholders the market transparency insurers have used for years
- AI adoption in underwriting is projected to jump from 14% today to 70% within three years
What is Data Analytics in Insurance?
Insurance data analytics is the process of collecting, processing, and interpreting large volumes of data to support decisions across underwriting, pricing, fraud detection, claims management, and customer service.
Two broad data types feed into this process:
- Structured data: claims histories, policy details, and financial records
- Unstructured data: broker notes, inspection reports, satellite imagery, and telematics from connected devices
Historically, insurers relied on actuarial methods: broad population averages drawn from mortality and loss tables. These approaches treated everyone within a demographic category identically. Modern analytics shifts that model toward individual-level insights, evaluating dozens of unique risk factors to deliver pricing and coverage recommendations tailored to actual behaviour and circumstances.
Half of European non-life insurers already deploy AI across pricing, underwriting, fraud detection, and claims, according to EIOPA's 2024 Digitalisation report. That adoption is already well underway. Insurers use analytics internally to improve efficiency, reduce losses, and optimise pricing. Independent platforms apply the same data principles to give consumers access to insights that were previously out of reach — whether they're overpaying, missing critical coverage, or carrying unnecessary duplicates.
Key Benefits of Data Analytics in Insurance
More Accurate Risk Assessment and Fairer Pricing
Analytics enables insurers to evaluate individual risk factors — credit history, driving behaviour via telematics, property inspection data, claims history — rather than relying solely on blunt demographic categories like age or postal code. This granularity produces premiums that better reflect a person's actual risk profile.
This cuts both ways. Good-risk customers can access lower premiums when their safe behaviour is visible to underwriters, while poor-risk pricing becomes harder to mask behind averaged-out demographic categories. For consumers, that means the data you generate — how you drive, where you live, how often you claim — increasingly determines what you pay.
Faster and More Efficient Claims Processing
Predictive models and automation dramatically reduce manual review time. A travel insurer handling 400,000 claims annually achieved 57% automation and reduced processing time from up to three weeks to minutes using AI-driven assessment. Only 7% of claims industry-wide currently use traditional straight-through processing, leaving 93% available for AI improvement.
Key improvements include:
- Automated claims triage by complexity and severity
- AI-generated settlement recommendations based on historical patterns
- Real-time status updates that improve customer satisfaction
- Reduced customer complaints by up to 65% in documented cases
Improved Fraud Detection
Faster claims processing also exposes a persistent cost buried within it: fraud. Analytics tools flag anomalies in claim patterns — duplicate submissions, suspiciously timed policy purchases, reused damage photos, or inflated valuations — in real time. Insurance fraud accounts for approximately 10% of total claims expenditure across Europe, representing billions in annual losses.
Machine learning models trained on millions of historical claims identify subtle fraud patterns impossible to detect manually. Detection rates for soft fraud — inflated legitimate claims — currently sit at only 20–40%, which means the majority of inflated claims still go undetected without AI intervention.
Greater Transparency and Consumer Empowerment
Data analytics benefits consumers when the same methods insurers use become accessible to policyholders. Independent platforms can analyse policies to reveal whether customers are overpaying, carrying duplicate coverage, or missing critical protections.
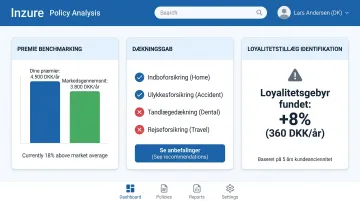
Inzure does this for Danish policyholders — analysing uploaded policy documents in 60 seconds to surface three things insurers rarely volunteer:
- Premium benchmarking: whether your current rate matches real-time market pricing
- Coverage gaps: missing protections such as bicycle theft or legal aid insurance
- Loyalty surcharges: long-term customers typically pay around DKK 2,400 more per year than new sign-ups for equivalent coverage
Better Regulatory Compliance and Reporting
Data analytics automates compliance tracking, data validation, and regulatory reporting. Insurers can monitor regulatory changes across jurisdictions, flag data quality issues before audits, and generate accurate reports with reduced manual effort. This protects policyholders by ensuring insurers operate within legal standards and maintain data integrity.
Top Use Cases of Data Analytics in Insurance
Underwriting and Risk Segmentation
Predictive modelling allows underwriters to evaluate applicants using both structured data (claims history, financial records) and unstructured data (broker notes, inspection reports, satellite property images). This moves underwriting from broad demographic categories to detailed individual risk profiles.
AI adoption in underwriting is expected to jump from 14% today to 70% within three years, based on a survey of 430 senior underwriting executives across 11 countries. Embedding generative AI in underwriting yields productivity gains up to 30%, with up to 65% of underwriting tasks subject to automation or augmentation.

Key capabilities this unlocks include:
- Processing broker submissions at scale with consistent accuracy
- Evaluating satellite imagery and inspection data without manual review
- Generating individual risk profiles rather than broad demographic estimates
QBE Insurance Group, for example, scaled AI-powered underwriting solutions across multiple lines of business and now processes 100% of broker submissions in product lines where the system is in production — accelerating market response time.
Dynamic and Usage-Based Pricing
Real-time behavioural data — pulled from telematics devices and smart home sensors — feeds directly into pricing models. In-car sensors track driving patterns; home monitors flag security system usage or water leak risk. Safe drivers and low-risk homeowners see that behaviour reflected in their premiums.
Usage-based insurance (UBI) is a direct product of data analytics capabilities. While predominantly applied to auto insurance (outside this article's scope), the principle extends to other lines: pricing that adjusts continuously based on actual risk exposure rather than annual renewal estimates.
Claims Management and Settlement Automation
Historical claims data enables automated triage, categorising claims by complexity and predicting fair settlement amounts. AI models reduce resolution time, minimise disputes, and improve customer experience by cutting wait periods.
Aviva deployed 80+ AI models in claims, achieving:
- Liability assessment time reduced by 23 days for complex cases
- Claim routing accuracy improved by 30%
- Customer complaints reduced by 65%
- Savings exceeding ca. 522 millioner DKK in 2024
One carrier uses AI to generate 50,000 claims-related communications daily, automating routine updates and freeing adjusters to handle complex cases requiring human judgment.
Fraud Detection and Prevention
Machine learning models trained on millions of historical claims identify fraud patterns such as clusters of high-value claims in short timeframes, inconsistencies in reported damage, or reused photos across multiple submissions.
AI-powered photo similarity scoring detects when damage images are recycled. In one documented case, photos of spoiled food and damaged appliances in a home insurance claim had been reused in three previous claims — a pattern virtually impossible to detect through manual review.
Industry estimates put the share of AI-manipulated claims — altered images, fabricated medical reports, or falsified valuation certificates — at 25–30% of submissions today. Multimodal AI technologies combining text, image, audio, and video analysis reduce false positives and improve detection accuracy, with projected insurer savings of 20–40% from integration.
Customer Insights and Churn Prevention
Analytics helps insurers understand customer behaviour: identifying at-risk customers (such as loyal policyholders subjected to automatic price increases), spotting cross-sell opportunities, and tailoring communication to retention goals.
Insurers use this data to manage portfolios and refine pricing strategies. The imbalance is notable: carriers have detailed behavioural profiles on every policyholder, while most customers have no visibility into their own situation.
Consumer-facing analytics tools are closing that gap — giving policyholders access to market benchmarks, coverage comparisons, and flags for loyalty surcharges built into renewal premiums.
Types of Data Analytics Used in Insurance
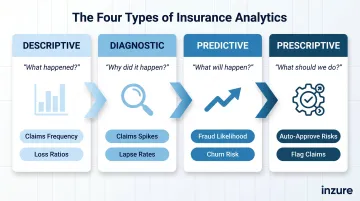
Insurance analytics breaks down into four distinct types, each answering a different question about data. Together, they form a progression from understanding the past to shaping future decisions.
| Analytics Type | Core Question | Insurance Examples |
|---|---|---|
| Descriptive | What happened? | Claims frequency by region, loss ratios by product line, premium trends over time |
| Diagnostic | Why did it happen? | Why claims spiked in a specific region, why certain segments show higher lapse rates |
| Predictive | What will happen? | Claim probability, fraud likelihood, customer churn risk, expected claim severity |
| Prescriptive | What should we do? | Approve or decline a risk automatically, flag claims for manual review, recommend coverage adjustments |
Descriptive analytics is the foundational layer — it identifies patterns and establishes the baselines that all other analysis builds on. Diagnostic analytics goes a step further, pinpointing the causal factors behind those patterns rather than just reporting them.
Predictive analytics is the most widely deployed advanced type in insurance today. It applies statistical models and machine learning to historical data to forecast outcomes before they occur. Prescriptive analytics takes those forecasts and turns them into action, integrating business rules and optimisation algorithms to guide operational decisions in real time.
Challenges and Ethical Considerations
Data Quality and Integration
Insurance data often resides in siloed systems — policy administration platforms, claims databases, broker management tools, third-party data vendors. Merging these into a reliable, unified dataset is technically difficult and resource-intensive. Poor data quality directly undermines the accuracy of any analytics model built on it, producing biased predictions or incorrect recommendations.
Privacy, Bias, and Algorithmic Fairness
Predictive models trained on historical data can inherit and reinforce existing biases, potentially leading to unfair pricing or coverage decisions for certain demographic groups.
GDPR Article 9 classifies health, biometric, and genetic data as special category data, which regulators generally prohibit from processing except under explicit consent or specific legal bases.
Under the EU AI Act, AI systems used for pricing and risk assessment in life and health insurance are classified as high-risk, requiring robust governance, transparency, and bias-mitigation controls. The EU's 2011 Test-Achats ruling banned gender-specific premium differentiation, establishing a precedent for prohibiting discriminatory factors in algorithmic pricing.
GDPR Article 22 grants consumers the right not to be subject to decisions based solely on automated processing that significantly affect them. For insurance pricing and underwriting, this requires explicit consent, contractual necessity, or legal authorisation. Even when an exception applies, insurers must guarantee:
- Human intervention in the decision process
- The consumer's right to express their viewpoint
- The ability to contest the automated decision
Explainability and Consumer Trust
These regulatory pressures connect directly to a broader challenge: explainability. Black-box AI models make decisions difficult to justify to customers or regulators — and the gap between algorithmic output and human understanding is widening as models grow more complex.
Insurers that cannot explain why a premium was set at a certain level, or why a claim was flagged, face regulatory action, consumer complaints, and long-term damage to their brand. Explainability isn't just a compliance checkbox — it's increasingly a market differentiator.
Future Trends in Insurance Data Analytics
Real-Time and Continuous Underwriting
The insurance industry is shifting from one-time policy issuance to dynamic, ongoing risk assessment. Connected devices, wearables, and telematics continuously feed data into models that update coverage and pricing in real time. This makes insurance more responsive to actual behaviour and life changes, aligning premiums more closely with current risk exposure rather than once-a-year renewal dates.
AI Agents and Automation of Complex Decisions
Beyond basic machine learning, AI agents are being developed to autonomously gather data from multiple systems, identify coverage gaps, recommend next actions for underwriters, and execute routine decisions with minimal human intervention.
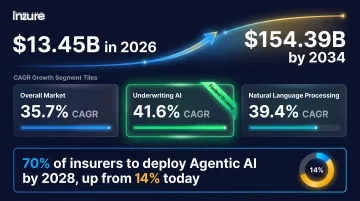
The scale of this shift is significant. According to a Fortune Business Insights market report, the global AI in insurance market is forecast to reach ca. 1.081 milliarder DKK by 2034 — up from ca. 94 milliarder DKK in 2026. Key growth segments include:
- Overall market CAGR: 35.7% through 2034
- Underwriting AI: Fastest-growing segment at 41.6% CAGR
- Natural language processing: Growing at 39.4% CAGR
- Agentic AI adoption: Celent projects 70% of insurers will deploy agentic AI by 2028, up from 14% today
The Rise of Consumer-Side Analytics Tools
The same analytics capabilities historically reserved for insurance companies are now becoming available to consumers. Independent platforms enable individuals to benchmark premiums against the market, detect duplicate coverage, identify missing protections, and make data-informed decisions about policies.
Europe is at the centre of this shift. According to an NTT DATA InsurTech Global Outlook report, Europe captured a record-high 35% share of global InsurTech deals in Q2 2024. Young Europeans increasingly demand digital, transparent insurance experiences — and many are willing to share personal data with insurers to get fairer pricing in return.
Platforms like Inzure reflect exactly this shift: applying AI to give consumers the same market intelligence that insurers have always kept to themselves.
Frequently Asked Questions
What is insurance policy data analysis?
Insurance policy data analysis examines policy details — coverage terms, pricing, claim history — alongside market data to assess whether a policy is appropriately priced and covers the policyholder's actual needs.
What are the main types of insurance policy data analysis?
The four main types are descriptive (what happened), diagnostic (why it happened), predictive (what will happen), and prescriptive (what should be done). Most modern insurance analytics combines all four to support end-to-end decision-making.
What types of data are common in insurance policy data analysis?
Key data types include structured data (claims history, policy details, financial records), unstructured data (broker notes, inspection reports), and external data (telematics, satellite imagery, weather data, market pricing benchmarks).
Is there a database for insurance policy data?
Insurance companies maintain internal policy and claims databases, and industry-level data-sharing platforms and regulatory databases exist. Most of this data is not publicly accessible to individual consumers, which is why third-party analytics tools are often used to compare options and surface pricing information.
What are the 5 C's of data analytics?
The 5 C's are Collection, Cleaning, Correlation, Conclusions, and Communication — covering how data is gathered, validated, analysed, interpreted, and presented to drive decisions.