Introduction
Most people discover gaps in their insurance policy only when filing a claim — by then, it's too late to fix the problem. A policy gap analysis is a structured way to compare what your current insurance covers against what it actually should cover, helping you identify blind spots before they become costly mistakes.
The cost of inaction cuts both ways. Policyholders often pay too much for duplicate coverage while remaining completely exposed in critical areas. Research from the Danish insurance industry reveals that approximately 7% of Danish households have no contents insurance at all, while nearly 20% of young people aged 18–30 lack basic coverage.
Pricing is just as problematic. Loyal customers pay 7–8% more on average than new customers for identical coverage, with some facing loyalty penalties of up to 35%.
This article covers 8 practical tools to conduct a policy gap analysis, from basic checklists to AI-powered solutions that complete the analysis in under 60 seconds.
Key Takeaways
- A policy gap analysis measures your current coverage against actual needs and market benchmarks — exposing gaps, duplicates, and overpriced policies
- Common signs include paying loyalty premiums, missing liability coverage, or holding duplicate policies from different providers
- The 8 tools range from structured checklists and risk matrices to AI-powered analysers suited to different review depths
- Some tools require manual research; others surface gaps in 60 seconds or less
- Closing policy gaps can cut premiums while improving or maintaining your protection level
What Is a Policy Gap Analysis and Why It Matters
A policy gap analysis compares what your insurance policy actually covers against what your life situation genuinely requires — and against what a fair market price looks like for that coverage. Instead of assuming your existing policies are adequate, a gap analysis identifies where you're exposed, where you're doubling up, and where you're paying more than necessary.
Three common types of gaps affect Danish consumers:
- Missing coverage — risks with no policy attached at all, so a claim leaves you paying out of pocket
- Duplicate coverage — the same protection appearing in two or more policies, meaning you're paying for something you already have
- Price gaps — premiums above the current market rate, often because long-term customers rarely compare alternatives
A gap analysis is not a one-time event. Buying a home, having children, or changing jobs all create new exposure that existing policies rarely cover automatically. Forbrugerrådet Tænk recommends reviewing contents insurance annually, and at minimum every two years — yet Forsikring & Pension notes that too few Danish households check their coverage regularly.
Having the right tools makes this review faster and far less likely to miss something.
8 Gap Analysis Tools to Identify and Close Policy Gaps
These tools range from pen-and-paper frameworks to automated platforms — the right choice depends on how deep you want to go and how much time you have.
Insurance Coverage Checklist
A coverage checklist is the simplest entry point: a structured document listing every risk category relevant to your life — home contents, travel, accident, liability, legal aid, bicycle theft, and more — mapped against the policies currently held.
A basic checklist structure includes:
- Current policy name and provider
- Coverage limit and deductible amount
- Key exclusions or conditions
- Last review date
This tool works well for first-time reviewers — it requires no special software and surfaces blind spots quickly. You can create a simple spreadsheet with columns for each risk area and rows for your existing coverage, then identify where protection is missing entirely.
Limitation: It identifies the "what" but not the "why" or how much it's costing you.
| Attribute | Detail |
|---|---|
| Best For | First-time policy reviewers and households managing multiple policies |
| Effort Level | Low — can be completed in 30-60 minutes with policy documents on hand |
| Key Output | A clear map of covered vs. uncovered risk areas |
SWOT Analysis Applied to Your Insurance Portfolio
SWOT (Strengths, Weaknesses, Opportunities, Threats) translates naturally to an insurance context:
- Strengths = solid coverage at fair premiums
- Weaknesses = exclusions, gaps, or high deductibles
- Opportunities = better products now on the market
- Threats = life changes that make current coverage inadequate
SWOT gives a holistic view and is particularly useful when a major life event — divorce, new home, new baby — forces a coverage rethink. Rather than just listing coverage, it helps you prioritise what to fix first based on strategic importance.
This framework is more strategic than operational, ideal for deciding which gaps deserve immediate attention versus which can wait.
| Attribute | Detail |
|---|---|
| Best For | Households going through a major life or financial change |
| Effort Level | Medium — requires honest self-assessment and some market awareness |
| Key Output | Prioritised list of coverage strengths to keep and weaknesses to address |
Benchmarking Tool
Benchmarking compares your current premium and coverage terms against what comparable policyholders in your market are paying for the same protection. This surfaces price gaps — situations where you're paying a loyalty premium for no additional benefit.
Why benchmarking is powerful: it turns a vague sense of "I might be overpaying" into a concrete number. Research from the Danish Competition and Consumer Authority shows that customers with 10 years of seniority pay 7-8 percentage points more on average than new customers, with some companies charging loyalty penalties of 30-35 percentage points for contents and home insurance.
Effective benchmarking requires access to current market data, which is why independent comparison platforms are more reliable than going directly to insurers who have an incentive to retain you at higher rates.
| Attribute | Detail |
|---|---|
| Best For | Long-term customers who haven't switched providers in 3+ years |
| Effort Level | Low to Medium — easiest when using a comparison platform |
| Key Output | A market price reference point and potential savings figure |
Risk Assessment Matrix
A risk matrix plots life risks on two axes — likelihood and financial impact — helping you prioritise which uninsured or under-insured risks pose the greatest real-world danger.
How to build a simple 2×2 grid:
- High likelihood / High impact — demand immediate coverage (e.g., home contents theft in urban areas)
- High likelihood / Low impact — consider self-insuring or high deductibles (e.g., minor mobile phone damage)
- Low likelihood / High impact — essential coverage despite rarity (e.g., liability claims, major property damage)
- Low likelihood / Low impact — often not worth insuring (e.g., extended warranties on low-value items)
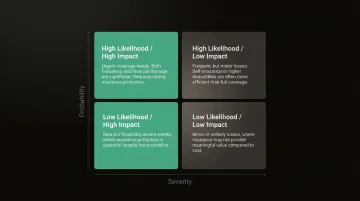
This tool's value lies in avoiding both over-insurance (paying for coverage you'll statistically never need) and under-insurance (ignoring high-impact risks because they feel abstract). It pairs well with the coverage checklist to turn your list into prioritised action items.
| Attribute | Detail |
|---|---|
| Best For | Consumers reassessing their full insurance portfolio from scratch |
| Effort Level | Medium — requires honest risk mapping and some actuarial thinking |
| Key Output | A ranked list of coverage priorities based on actual risk exposure |
Life Event Trigger Review
This tool is a structured review process triggered by specific life milestones: getting married, having a child, buying a home, changing jobs, retiring, or taking on a mortgage. Each life event typically creates new coverage needs that existing policies don't automatically update to reflect.
Many gaps exist simply because a policy was bought years ago and never revisited. For example, contents insurance purchased when you were single won't automatically cover your partner's belongings after you move in together, as documented in real cases where partners were entirely missing from home, accident, and travel insurance policies.
Practical approach:
Create a list of 10-12 common life triggers and check whether your current policies have been reviewed since each one occurred. If you've experienced any trigger in the past 2-3 years without updating your insurance, a gap likely exists.
| Attribute | Detail |
|---|---|
| Best For | Adults who have experienced major life changes in the past 2-3 years |
| Effort Level | Low — primarily a prompted self-reflection exercise |
| Key Output | Identification of coverage that has become outdated or insufficient |
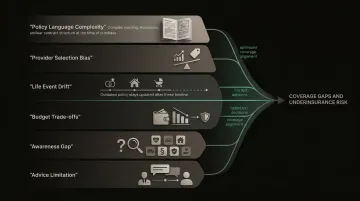
Fishbone Diagram for Root-Cause Coverage Analysis
A fishbone (Ishikawa) diagram traces a known coverage gap back to its root cause by mapping contributing factors across categories: policy language, provider selection, life changes, budget constraints, lack of awareness, and advice quality.
Unlike other tools, it focuses on root causes — not just what the gap is, but why it formed.
Common root causes identified through fishbone analysis:
- Policy language — complex terms or exclusions you didn't understand when purchasing
- Provider selection — choosing based on price alone without reviewing coverage details
- Life changes — failing to update policies after marriage, relocation, or family expansion
- Budget constraints — dropping coverage to save money without assessing actual risk
- Lack of awareness — not knowing certain coverage types existed
- Advice quality — receiving incomplete guidance from a broker tied to specific insurers
This tool is particularly valuable for consumers who have experienced a claim denial or coverage shortfall and want to understand systematically what went wrong to prevent it from recurring.
| Attribute | Detail |
|---|---|
| Best For | Post-claim analysis or consumers who have already identified a gap and want to understand its cause |
| Effort Level | Medium — benefits from team input (for example, a broker or adviser) |
| Key Output | Root causes of the gap and targeted corrective actions |
Duplicate Coverage Detector
A duplicate coverage detector is a review process (or feature within an analysis platform) that cross-checks all active policies for overlapping coverage — for example, travel insurance bundled with a credit card alongside a standalone travel policy, or contents insurance covered under both a home policy and a renter's policy.
The financial consequence of duplicates:
Consumers pay double premiums without gaining additional protection, since most policies have "contribution clauses" preventing double payouts. Under the Danish Insurance Contracts Act (FAL § 42), when the same interest is insured against the same risk with multiple companies, the companies share the liability proportionately — meaning you're compensated only once but paying twice.
The European Insurance and Occupational Pensions Authority found that duplicate travel insurance is particularly common, with consumers purchasing annual policies while already holding overlapping cover through credit cards.
Finding and eliminating duplicates is one of the fastest ways to reduce insurance spend without losing protection.
| Attribute | Detail |
|---|---|
| Best For | Consumers holding 3+ policies across multiple providers |
| Effort Level | Low to Medium — easier with a platform that reads all policies simultaneously |
| Key Output | List of overlapping coverages and estimated savings from removing duplicates |
AI-Powered Policy Analysis Tool
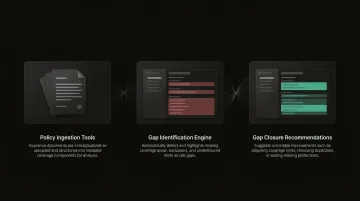
AI-powered tools automate the gap analysis process by reading policy documents, comparing coverage terms against your profile, and flagging gaps, duplicates, and price anomalies.
This matters most for consumers holding multiple complex policies who lack the time or expertise to interpret policy language themselves. Traditional manual review takes around 10 hours; AI-powered analysis delivers the same output in under a minute.
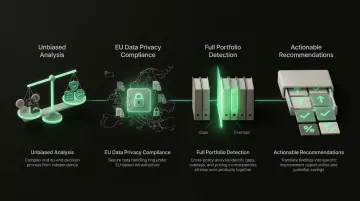
Inzure is Denmark's independent AI-driven insurance platform that performs a full policy analysis in 60 seconds — identifying missing coverage, duplicate policies, and above-market premiums across major Danish insurers. The platform reads complete policy documents (uploaded as PDFs or screenshots), extracts important information including fine print, and compares your coverage, prices, and terms against the current market.
Key advantages of Inzure's approach:
- Not tied to any insurer, so analysis and recommendations are unbiased
- All user data stored in the EU under GDPR-compliant privacy regulations
- Detects gaps, overlaps, and pricing errors across your full policy portfolio
- Delivers clear recommendations with specific savings amounts attached
Real examples from early users show savings ranging from 2,800 kr/year to 48,000 kr/year, with the platform identifying critical issues like missing contents insurance for 10+ years and partners completely absent from family policies.
| Attribute | Detail |
|---|---|
| Best For | Any policyholder who wants a fast, unbiased, complete picture of their insurance situation |
| Effort Level | Very Low — upload or connect your policies and receive an automated report |
| Key Output | Full gap report including missing coverage, duplicates, and market price comparison with potential savings |
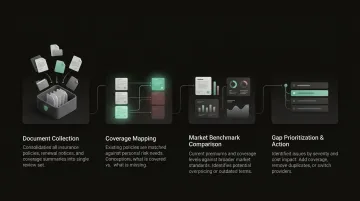
How to Conduct an Insurance Policy Gap Analysis
Follow these four clear steps:
- Gather all active policy documents in one place — collect PDFs, renewal notices, and coverage summaries from every insurance provider
- Map current coverage against your life situation and risk profile — use a checklist or risk matrix to identify what's covered versus what should be covered based on your actual circumstances
- Compare your premiums and coverage terms against current market benchmarks — use a comparison platform or benchmarking tool to see whether you're paying above-market rates
- Prioritise gaps by severity and cost, then take action — address high-impact gaps first, whether that means adding coverage, removing duplicates, or switching providers
Getting the steps right matters — but so does avoiding the pitfalls that make most gap analyses miss the mark.
Common mistakes to avoid:
- Reviewing only one policy in isolation — gaps often exist in the relationship between policies
- Relying on your current insurer's advice for a comparison — they have a conflict of interest in retaining you at higher premiums
- Treating a gap analysis as a one-off exercise rather than an annual habit — your risk profile changes as your life changes
Time investment varies by approach: a manual checklist takes a few hours, while an AI-powered platform like Inzure can analyse your policies in 60 seconds. That difference is what makes the annual habit realistic for most people.
How We Chose These 8 Tools
Tools were chosen based on three criteria:
- Practical applicability to individual insurance consumers (not just businesses)
- Ability to surface actionable insights without requiring specialist knowledge
- Coverage of different gap types — missing coverage, duplicates, pricing, and root-cause analysis
No single tool handles every gap type. The most effective approach combines a quick structural review (checklist or AI tool) with a deeper diagnostic tool (risk matrix or fishbone) for gaps that need root-cause understanding. Start with the fastest tool you'll actually open — then layer in deeper analysis only where a gap requires it.
Conclusion
Insurance gaps are common, often invisible, and expensive — both in premiums paid for duplicated coverage and in claims that aren't paid when they should be. Research shows that 7% of Danish households lack contents insurance entirely, while nearly 20% of young Danes aged 18-30 are uninsured. Those who do have coverage often pay loyalty penalties of 7-35% above market rates — not because they chose to, but because no one flagged it.
The right gap analysis tool moves you from guessing to knowing. For Danish consumers, Inzure's 60-second AI policy analysis reads your existing policies, identifies gaps and overlaps across Danish carriers, and shows what your insurance should actually cost — free to use, with no obligation to switch.
Frequently Asked Questions
How do you conduct a policy gap analysis?
Gather all policy documents, map current coverage against your actual needs and risk profile, benchmark your premiums against the market, and prioritise the gaps by financial impact before acting. Done manually, this takes several hours; AI-powered tools like Inzure can run the same analysis in under 60 seconds.
What are the most common policy gap analysis tools?
The most widely used tools include coverage checklists, benchmarking platforms, SWOT analysis, risk matrices, and AI-powered policy analysers. The best choice depends on whether you need a quick overview or a deep diagnostic review.
How often should I review my insurance coverage for gaps?
Review your coverage annually as a minimum, plus immediately after any major life event such as buying a home, having a child, changing jobs, or getting married. Existing policies rarely expand automatically to cover these changes.
What is the difference between a coverage gap and duplicate coverage?
A coverage gap means a risk you face is not insured at all, leaving you financially exposed. Duplicate coverage means the same risk is insured twice across multiple policies, wasting premium budget without providing additional protection due to proportionate liability rules.
Can I find insurance policy gaps without professional help?
Yes, several tools — including coverage checklists, risk matrices, and AI-powered platforms — are designed for anyone to use without specialist knowledge. However, a broker can add value for complex situations requiring detailed interpretation.