
Introduction
Most people pay insurance premiums year after year without ever questioning whether the coverage is actually worth what they're paying. This lack of scrutiny is precisely what the insurance industry relies on. Danish consumers often spend thousands of kroner annually on policies they don't fully understand, trusting that their insurer is looking out for their best interests.
Insurance policies are intentionally complex — and that complexity is the business model. When documents are filled with jargon, exclusions buried in fine print, and pricing structures kept deliberately opaque, comparing costs against real protection value becomes nearly impossible.
The result: overpayment for duplicate coverage, critical gaps going unnoticed, and loyal customers subsidizing discounts for new ones.
This guide covers a practical framework for changing that: what insurance cost-benefit analysis actually is, how to apply it step by step to your own policies, a real-life Danish family example, and how modern tools have compressed what used to be a 10-hour process into a 60-second task.
Key Takeaways
- Insurance cost-benefit analysis compares what you pay against the real financial protection you receive—determining if each policy is worth keeping, adjusting, or replacing
- It accounts for premiums, deductibles, and out-of-pocket costs alongside coverage breadth, payout likelihood, and peace of mind
- Most Danish households are either over-insured with overlapping policies, under-insured with coverage gaps, or both
- Follow five steps: define your goal, map costs, evaluate benefits, calculate net value, then act on what you find
- Inzure automates this analysis in 60 seconds — no hours of manual comparison required
What Is Insurance Cost-Benefit Analysis?
Insurance cost-benefit analysis (CBA) is a structured method for weighing the total costs of holding a policy—premiums, deductibles, exclusions, and opportunity costs—against the total benefits: financial protection, claims payout probability, and risk reduction. The goal is to determine the policy's net value.
This differs fundamentally from simply shopping for a cheaper price. CBA assesses value, not just cost. A cheaper policy with poor coverage can deliver a worse cost-benefit ratio than a more expensive one covering real risks. For example, a DKK 3,000 annual premium with comprehensive coverage and a DKK 2,000 deductible may offer better value than a DKK 2,200 premium with a DKK 10,000 deductible that makes most claims financially pointless.
That pricing comparison points to a distinction worth understanding: CBA is not the same as cost-effectiveness analysis (CEA). According to the European Insurance and Occupational Pensions Authority, CBA determines whether total benefits outweigh total costs in monetary terms — a yes/no value decision. CEA, by contrast, compares two options to find the most efficient route to a fixed goal.
CEA is useful when you must hold insurance (for example, fire insurance required by your mortgage lender) and want to find the cheapest provider for identical coverage. CBA is the tool for deciding whether to hold a policy at all.
Why Doing a CBA on Your Insurance Policies Matters
The Loyalty Penalty Problem
Research consistently shows that long-term customers pay more than new customers for identical coverage. Inzure's internal analysis of Danish insurance customers reveals a concrete example: a loyal customer paying DKK 4,800 annually in year one saw their premium climb to DKK 7,200 by year ten—a 50% increase for the same coverage. That's DKK 2,400 extra per year simply for staying put.
This isn't pricing error. It's deliberate. Insurers know most customers won't review their policies annually, so they gradually increase premiums for existing clients while offering aggressive discounts to attract new ones. Your loyalty becomes their profit.
Duplicate Coverage You're Already Paying For
Many Danish households unknowingly hold multiple policies covering the same risk:
- Travel insurance through a credit card and a standalone rejseforsikring
- Contents coverage overlapping between home insurance and a separate indboforsikring
- Accident insurance duplicating workplace benefits already provided by an employer
CBA forces you to surface these overlaps and eliminate wasted spend. One Inzure customer discovered she had been paying for her newborn son's coverage when children under two should have been covered for free—and simultaneously found her partner wasn't listed on their contents, accident, or travel policies despite paying for family coverage.
The Coverage Gap Risk
Without structured analysis, consumers often discover missing coverage only when attempting to claim. A proper benefit evaluation identifies what is not covered just as clearly as what is. One 86-year-old Inzure customer learned she had gone without home contents insurance for at least 10 years—a gap she only discovered through AI-powered policy analysis.
Opportunity Cost
Every krone overpaid in premiums is a krone that could be saved, invested, or used elsewhere. Insurance isn't a fixed obligation—it's a financial decision that should be regularly reviewed and adjusted. Sound financial decision-making means weighing what you spend against what you actually get—and insurance is no different.
Decision Confidence
Rather than making insurance decisions based on habit or insurer marketing, structured analysis gives you objective criteria to act on. This reduces anxiety and increases financial clarity. When you can see exactly what you're paying and what you're getting, the decision makes itself.
How to Conduct an Insurance Cost-Benefit Analysis: Step by Step
Six steps. That's all it takes to move from "I think I'm overpaying" to a clear, evidence-based decision about any policy you hold.
Step 1 – Define Your Goal
Clarify what you're trying to determine:
- Is this policy worth renewing at the current price?
- Am I getting fair market value compared to competitors?
- Is my coverage level appropriate for my current life situation?
Being specific about the question prevents vague analysis. For example, "Should I keep my travel insurance?" is too broad. "Does my DKK 1,800 annual travel policy provide better value than the coverage already included with my credit card?" is actionable.
Step 2 – Map All Your Costs
List every cost associated with the policy:
- Annual or monthly premium – the base cost
- Deductible (selvrisiko) – what you pay out-of-pocket before coverage kicks in
- Administration fees – any processing charges for policy changes or claims
- Opportunity cost – what that capital could earn if invested or saved elsewhere
Indirect costs matter too. Time spent managing claims, filling out paperwork, or disputing coverage decisions still costs you — it just doesn't show up on an invoice.
Step 3 – Evaluate Your Benefits
Assess both financial and intangible benefits:
Financial benefits:
- Maximum payout limits
- What events are actually covered (not just what's marketed)
- Claims payout history for similar events
- Coverage breadth (exclusions matter as much as inclusions)
Intangible benefits:
- Peace of mind
- Legal compliance (where mandatory)
- Customer service quality
Critical warning: Be realistic. Not all listed "benefits" in a policy document translate to likely real-world payouts. A policy claiming DKK 500,000 maximum coverage with 47 exclusions and a DKK 25,000 deductible delivers far less practical benefit than the headline number suggests.
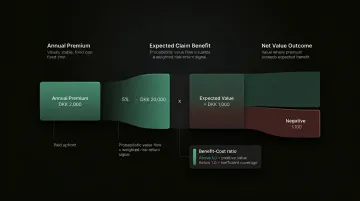
Step 4 – Calculate Net Value
The core formula is straightforward:
Net Benefit = Total Expected Benefits (monetised) – Total Costs
Introduce payout probability into your calculation. A policy covering a rare event with a low annual premium has a different net value than one covering a common risk. For example:
- DKK 2,000 annual premium for travel insurance with a 5% probability of needing to claim DKK 20,000 = expected benefit of DKK 1,000
- Net value = DKK 1,000 – DKK 2,000 = –DKK 1,000 (negative value)
A benefit-cost ratio above 1.0 signals the policy delivers value. Below 1.0 signals it may not be worth holding.
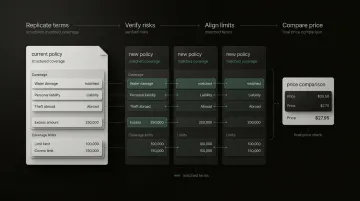
Step 5 – Compare Against the Market
Once you have your net value, that number needs context. The same coverage may be available for significantly less from another provider. Without a market benchmark, you only know what a policy costs you — not what it should cost.
Even a positive net benefit ratio doesn't mean you're getting the best available deal. If the market offers a better ratio for identical coverage, switching is the better call.
Step 6 – Act and Review
Three possible actions emerge:
- Keep it – analysis confirms the price is fair and coverage fits your situation
- Renegotiate – ask your insurer to adjust coverage levels or match a competitor's price
- Switch – a better-value policy exists elsewhere and the numbers support moving
CBA is not a one-time exercise. A new home, a new family member, or a new car all shift both your costs and your coverage needs. Revisiting your analysis annually keeps your policies aligned with your actual situation.
Insurance CBA in Practice: A Real-Life Example
Consider a Danish family holding four policies that haven't been reviewed in three years:
- Home insurance (husforsikring): DKK 3,200/year
- Contents insurance (indboforsikring): DKK 2,400/year
- Car insurance (bilforsikring): DKK 5,800/year
- Standalone accident insurance (ulykkesforsikring): DKK 1,600/year
Total annual cost: DKK 13,000
The Cost Side
When mapping total costs, the family discovers:
- The contents policy overlaps significantly with a section of the home insurance—both cover theft and damage to personal belongings within the home
- The accident insurance partially duplicates workplace coverage the primary earner already receives through their employer's benefits package
- The car policy includes a DKK 12,000 deductible, meaning most realistic claim scenarios wouldn't justify filing given the impact on future premiums
The Benefit Side
Evaluating realistic payout scenarios reveals:
- The home insurance would pay out in genuine disaster scenarios (fire, flooding), justifying its cost
- The contents policy's overlap means the family is paying twice for the same protection
- The accident insurance covers scenarios already handled by the employer benefit—wasted spend
- The car policy's high deductible makes it effectively a catastrophic-loss-only policy, yet the family is paying for comprehensive coverage pricing
- Critical gap identified: No roadside assistance or legal liability extension on the car policy, despite the family taking frequent road trips
The Conclusion and Action
The CBA reveals:
- Duplicate coverage in two areas (contents/home overlap + accident/workplace overlap) = potential DKK 2,800 annual saving
- Poor benefit-cost ratio on the car policy due to unrealistic deductible
- Genuine coverage gap requiring attention
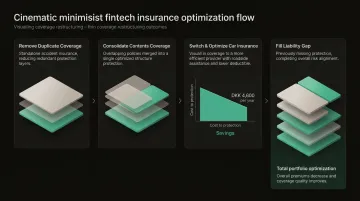
Net result: By restructuring their coverage, the family takes four concrete steps:
- Cancels the standalone accident insurance (duplicated by employer benefits)
- Eliminates the overlapping contents coverage section
- Switches car insurance to a provider with roadside assistance and a lower deductible at DKK 4,600/year
- Fills the liability gap that was previously unaddressed
Total annual premiums drop to DKK 9,400 — while improving actual protection.
Total annual saving: DKK 3,600 with better coverage than before.
How Inzure Simplifies Your Insurance Cost-Benefit Analysis
Inzure is Denmark's AI-driven, independent insurance platform built specifically to eliminate the information gap that makes manual insurance CBA time-consuming and unreliable. The platform reads and analyses your existing policies across Danish insurers in 60 seconds, delivering the kind of structured cost-benefit overview that used to require hours of research or a paid broker.
Key Capabilities Mapped to the CBA Process
Automatic duplicate and gap identification (Steps 2-3): The AI reads policy documents—including fine print—and extracts coverage details to surface overlaps and missing protections most people overlook. Customers have discovered they were paying for coverage already included elsewhere, or missing critical protections despite holding multiple policies.
Real market price benchmarking (Step 5): Inzure compares your current coverage and pricing against other companies across the Danish market, showing whether you're paying above or below fair value. You see exactly where you stand — not just against your current insurer, but the full market.
Ongoing monitoring (Step 6): The platform continuously tracks market conditions and alerts you when prices shift or better deals emerge. Once configured, it runs quietly in the background and only notifies you when a meaningful opportunity appears.
Verified customer outcomes show what this looks like in practice:
- Hans Henrik Beck saved DKK 48,000 per year after eight years with Tryg — a 46% premium reduction
- Lise Nielsen (age 86) saved DKK 2,800 annually and discovered she had been without contents insurance for at least 10 years
- Thomas Stolborg achieved a 35% reduction worth DKK 25,000 per year

Independence and Transparency
Inzure is not affiliated with any insurance company and charges no hidden fees. The fee structure is straightforward:
- Better deal found with savings: Inzure earns 20% of your confirmed annual savings
- Better coverage at the same price: The service is free
- No better deal found: The analysis is free
This means Inzure only gets paid when you genuinely benefit.
The platform stores all data in EU-compliant GDPR infrastructure and does not share customer information with insurers unless explicitly requested by the user.
Frequently Asked Questions
What are the 5 steps of cost-benefit analysis?
The five steps are: define your goal (what you're evaluating and why), identify and total all costs (premiums, deductibles, opportunity costs), identify and quantify all benefits (payout scenarios, coverage breadth, peace of mind), calculate net benefit or benefit-cost ratio, and act on the findings by keeping, adjusting, or switching the policy.
What is cost-benefit analysis in insurance?
Insurance CBA is the process of comparing what a policyholder pays—premiums, deductibles, fees—against the financial protection and risk reduction they receive, to determine whether each policy delivers net positive value and whether a better alternative exists in the market.
What is the difference between cost-benefit analysis and cost-effectiveness analysis in healthcare?
CBA measures whether total benefits outweigh total costs in monetary terms (a yes/no value decision), while cost-effectiveness analysis compares two options to find the most efficient path to a given outcome. CBA answers "Should I hold this policy?" while CEA answers "Which of these two policies is the better buy?"
What are the advantages of cost-benefit analysis?
CBA forces objective, data-driven decision-making, surfaces hidden costs and overlooked benefits like duplicate coverage, benchmarks value against market alternatives, and replaces inertia-driven decisions with structured financial reasoning.
What is a good example of cost-benefit analysis?
A consumer paying DKK 4,000 annually for a policy with a DKK 10,000 deductible covering low-probability events likely has a poor benefit-cost ratio. The expected payout value over time—factoring in realistic claim probability—is less than the cumulative premiums paid, making the policy poor value despite appearing comprehensive on paper.
Why is cost-benefit analysis important in healthcare?
In healthcare and health insurance, CBA helps individuals and policymakers evaluate whether the financial cost of coverage or intervention is justified by the health outcomes and cost savings it generates. The analysis applies directly when comparing plans with different premium levels, deductibles, and coverage scopes—ensuring you pay for protection, not just paperwork.